Snapshots penalize young leads
Recent inquiries have not had equal time to convert. Cohort reporting fixes the clock before performance is judged.
 PENNANT
For continuing education & online programs
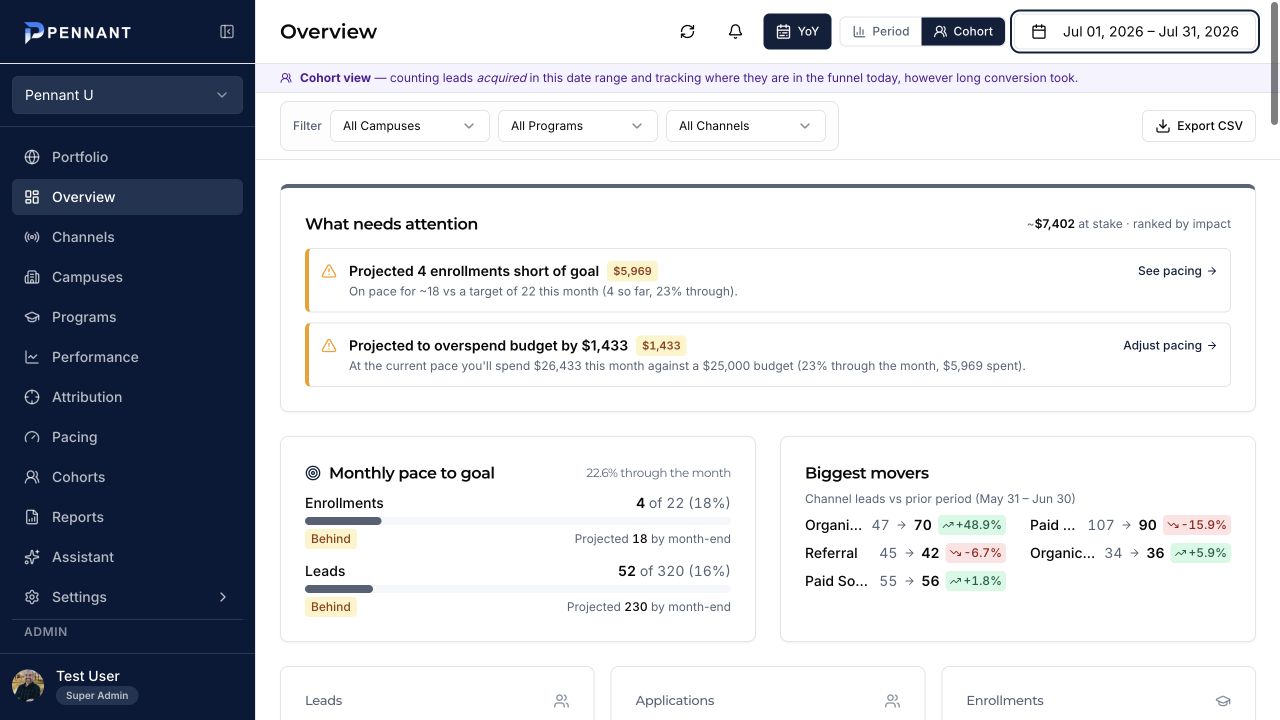
With continuous intakes, a campaign that looks weak this month may still convert next quarter. Pennant’s cohort view follows leads acquired in a defined window forward, so marketing is judged on what the cohort eventually produces.
The job to be done
Recent inquiries have not had equal time to convert. Cohort reporting fixes the clock before performance is judged.
Adult learners progress on different schedules. Maturity views show how each acquisition cohort develops.
Use observed progression and historical context to decide whether a young cohort needs more time or intervention.
How Pennant helps
Track the same acquired population forward through application and enrollment.
Use operating-period results for workload while preserving cohort outcomes for acquisition quality.
Compare equivalent enrollment windows instead of relying on misleading calendar snapshots.
See the Pennant product, understand how the data becomes decision-ready, or explore our enrollment marketing guides and insights.