Connect
Bring advertising, CRM, budget, goal, and reporting sources into one documented data flow.
 PENNANT
Pennant Signal
The enrollment intelligence system that turns disconnected advertising, CRM, budget, and funnel data into signals your team can understand and act on.
A productized operating system
Pennant Signal is more than dashboard software. It is a repeatable system for connecting the evidence, reconciling the definitions, understanding performance, and acting while the enrollment cycle is still moving.
Bring advertising, CRM, budget, goal, and reporting sources into one documented data flow.
Normalize enrollment language and make conflicting totals, mappings, and coverage visible.
Read performance through the right period, cohort, campus, program, channel, and seasonal lens.
Turn pacing and outcome signals into clearer budget, campaign, and enrollment decisions.
What you receive
The exact scope depends on your systems and reporting requirements. Every Pennant Signal engagement is organized around the same concrete operating components.
A source and field map covering the advertising, CRM, budget, goal, campus, program, and reporting inputs included in scope.
An institution-specific environment with approved dimensions, funnel stages, date logic, and access aligned to the reporting model.
Operational views for pacing, attribution, period and cohort reporting, campus and program performance, and available exports.
Visible definitions, reconciliation checks, known exceptions, and ownership decisions so the numbers can be explained after launch.
Scope matters: available sources, refresh methods, historical coverage, and features are confirmed during discovery. Pennant does not imply that every connector or dataset is available in every implementation.
Designed around the next decision
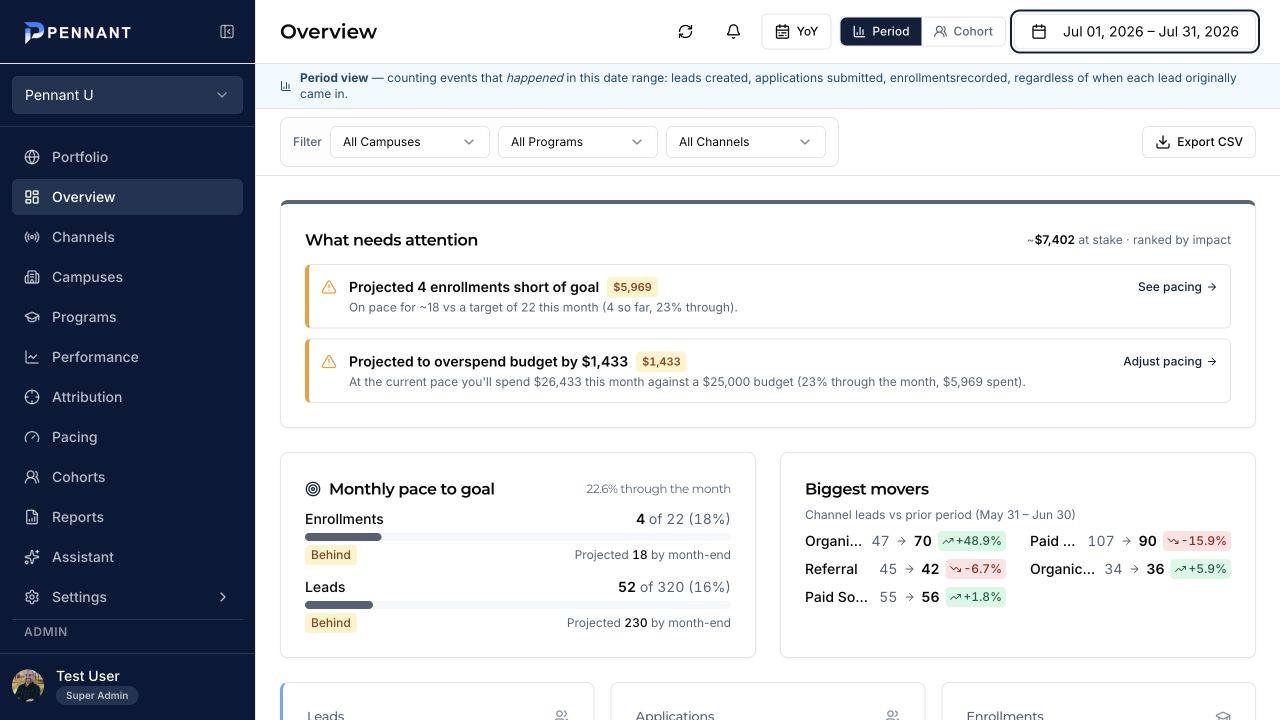
Pennant ranks enrollment and budget risks by impact, then lets your team move directly into pacing, attribution, performance, and cohort detail. Every view uses the same filters and enrollment definitions.
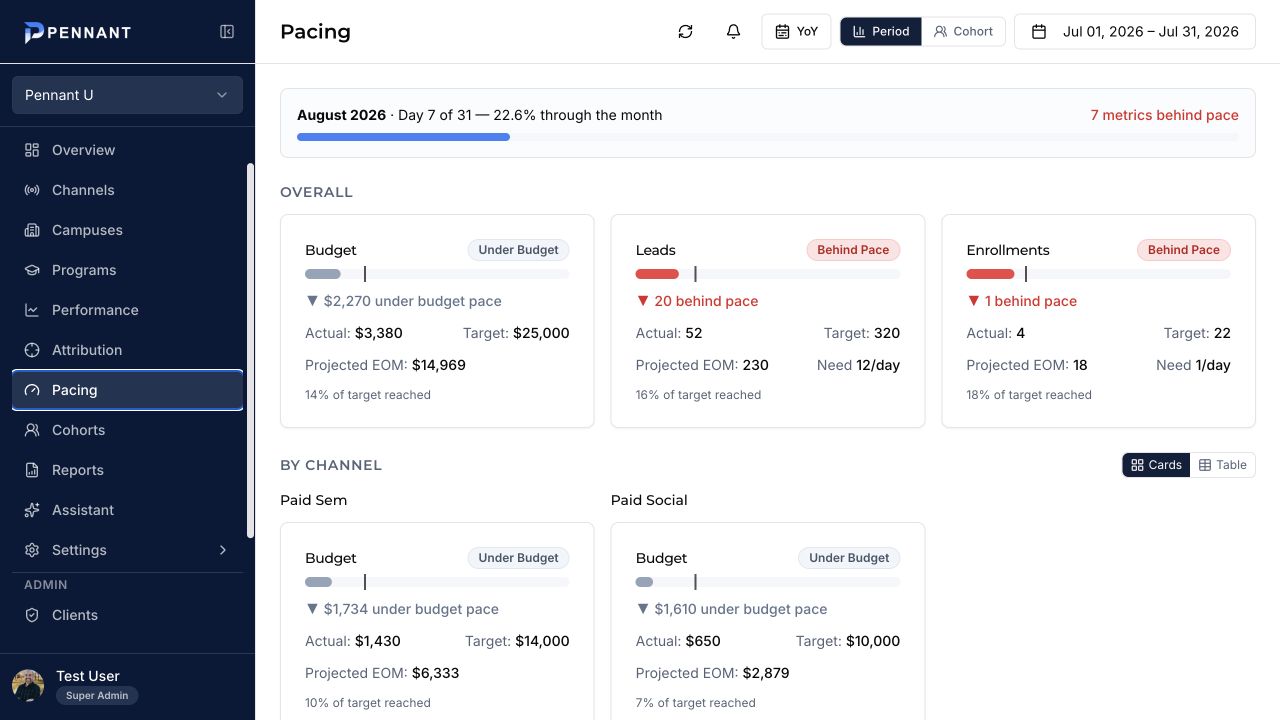
Pacing
Compare actual results with expected pace, projected month-end performance, and the daily volume required to recover. Review overall goals or move channel by channel.
Attribution
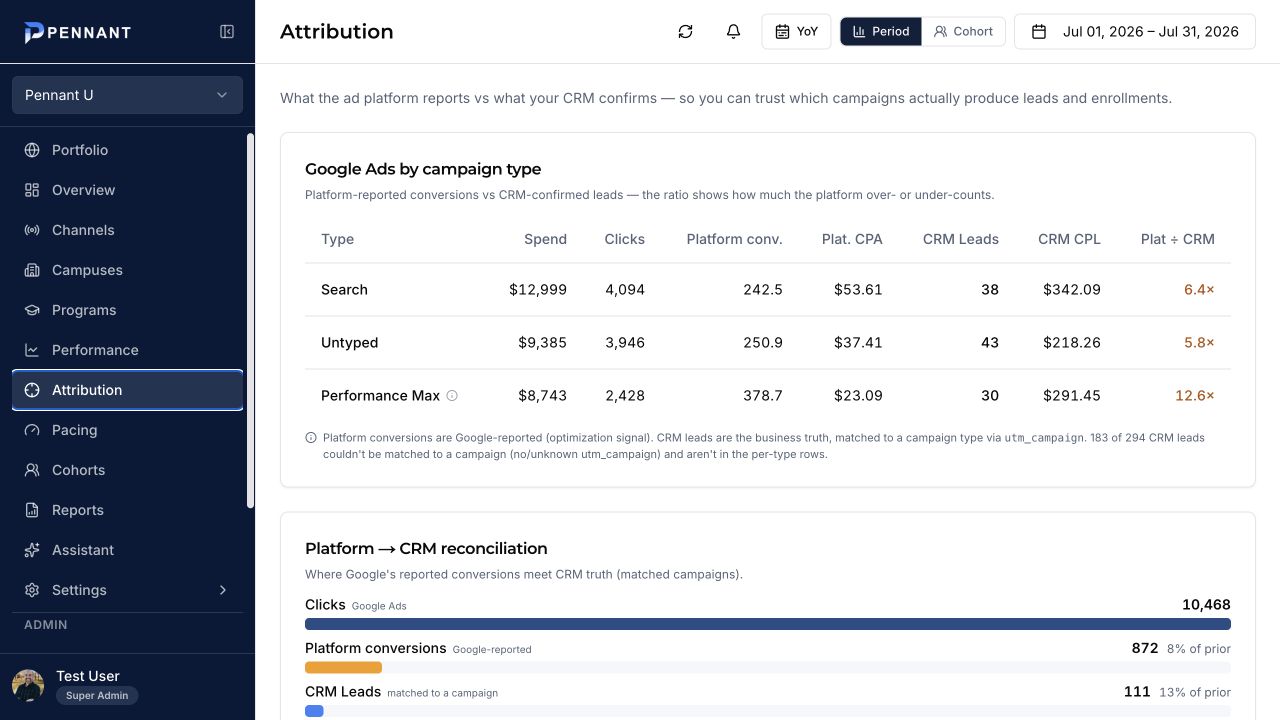
Reconcile advertising-platform conversions with CRM-confirmed leads, applications, and enrollments. Pennant makes overcounting and unmatched campaign data visible instead of burying it.
A connected decision system
Surface pacing gaps, overspend risk, and channel movement by likely impact—not by dashboard position.
Compare actual performance, expected progress, month-end projections, and the daily pace needed to reach target.
See what advertising platforms report beside the leads and enrollments your CRM actually confirms.
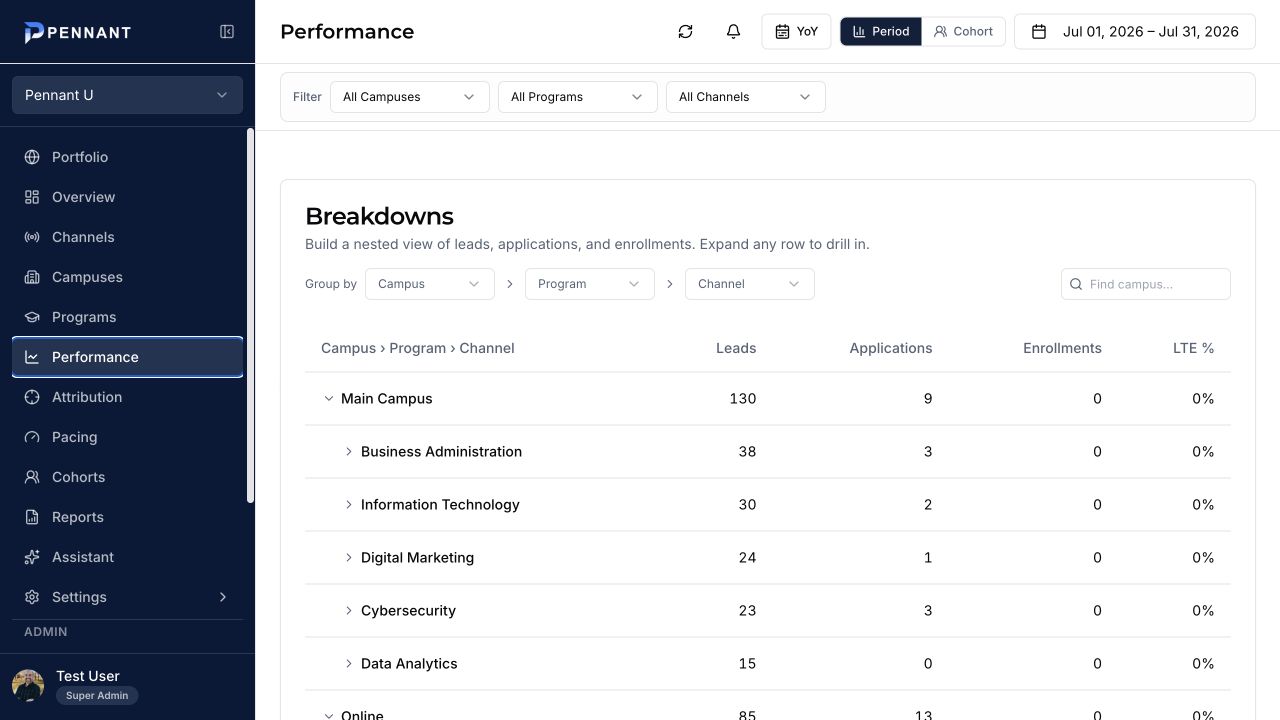
Drill from campus to program to channel and compare leads, applications, enrollments, and lead-to-enrollment rate.
Track how leads acquired in a period progress through applications and enrollments—even when conversion takes months.
Ask plain-English questions about spend, CPL, CPE, trends, campaigns, campuses, and enrollment outcomes.
Reporting lenses
Period, Cohort, and year-over-year comparisons use the same normalized enrollment data while applying different date logic.
Review events recorded inside the selected window, regardless of when each lead entered the funnel.
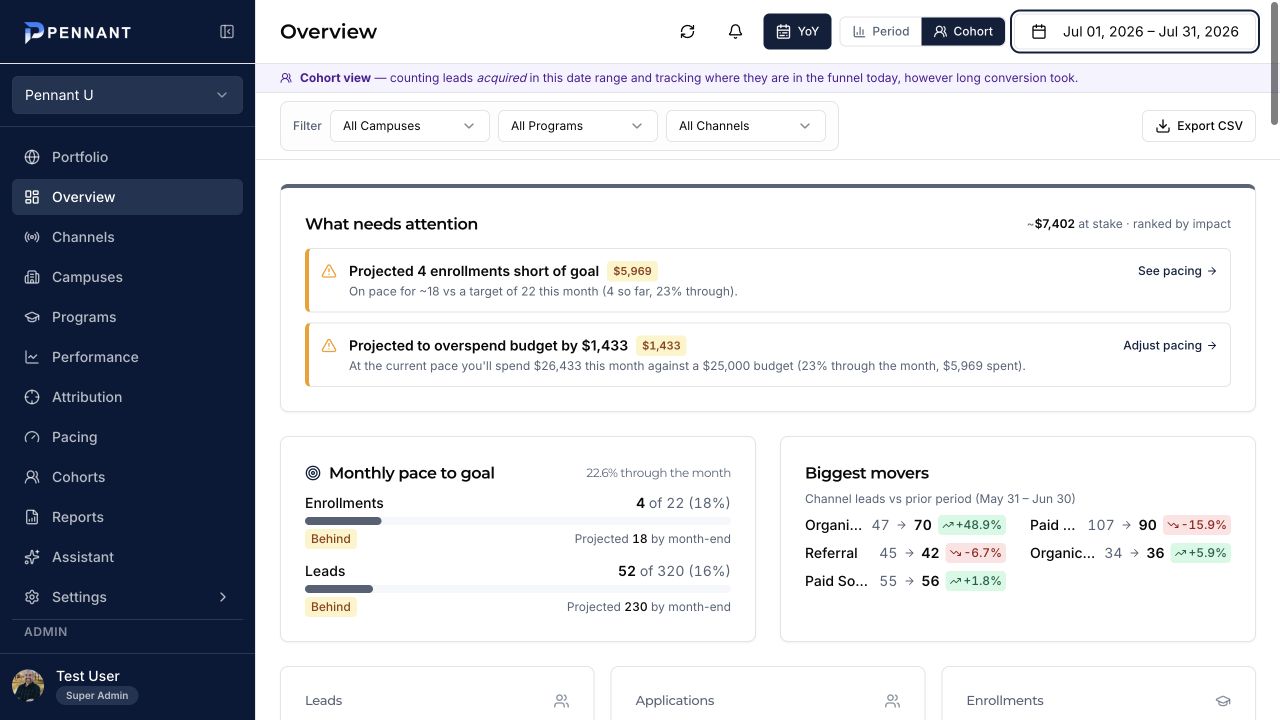
Follow leads acquired in the selected window into later applications and enrollments.
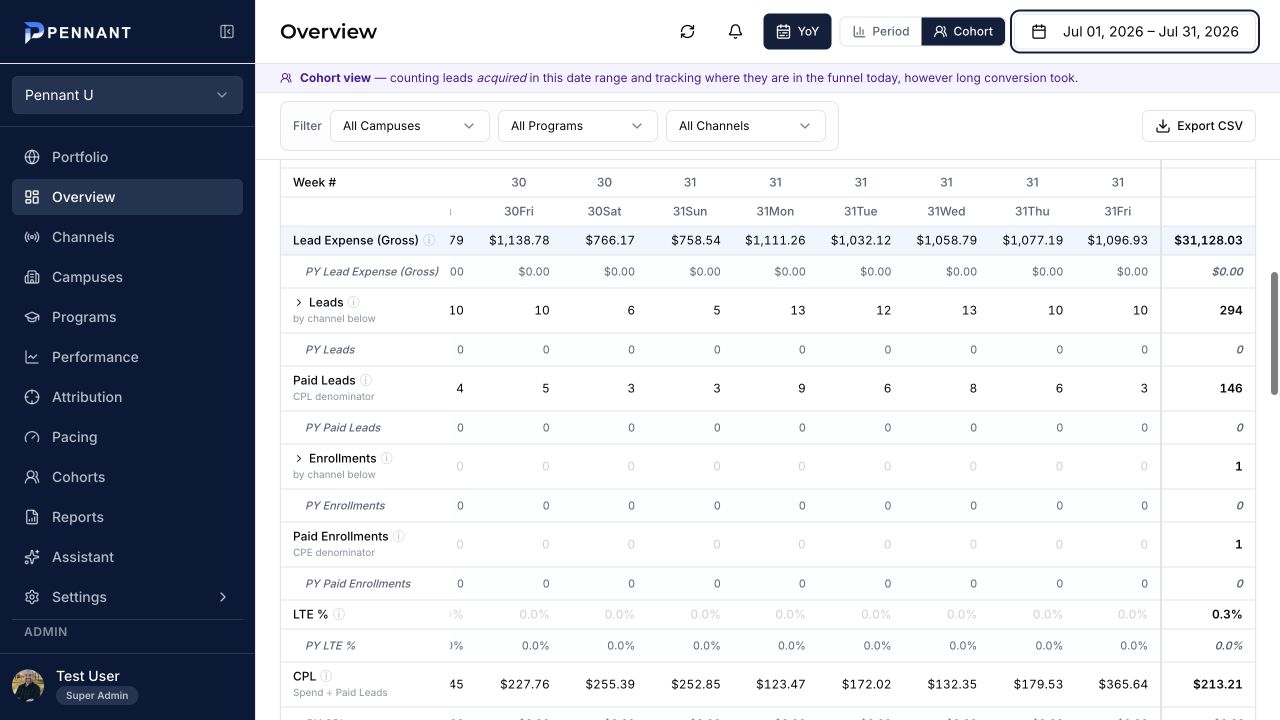
Add equivalent prior-year rows to the current reporting window for historical and seasonal context.
Explore every dimension
Move from an institution-wide view into the channel, campus, or program that needs attention—then turn the same data into a leadership-ready export.
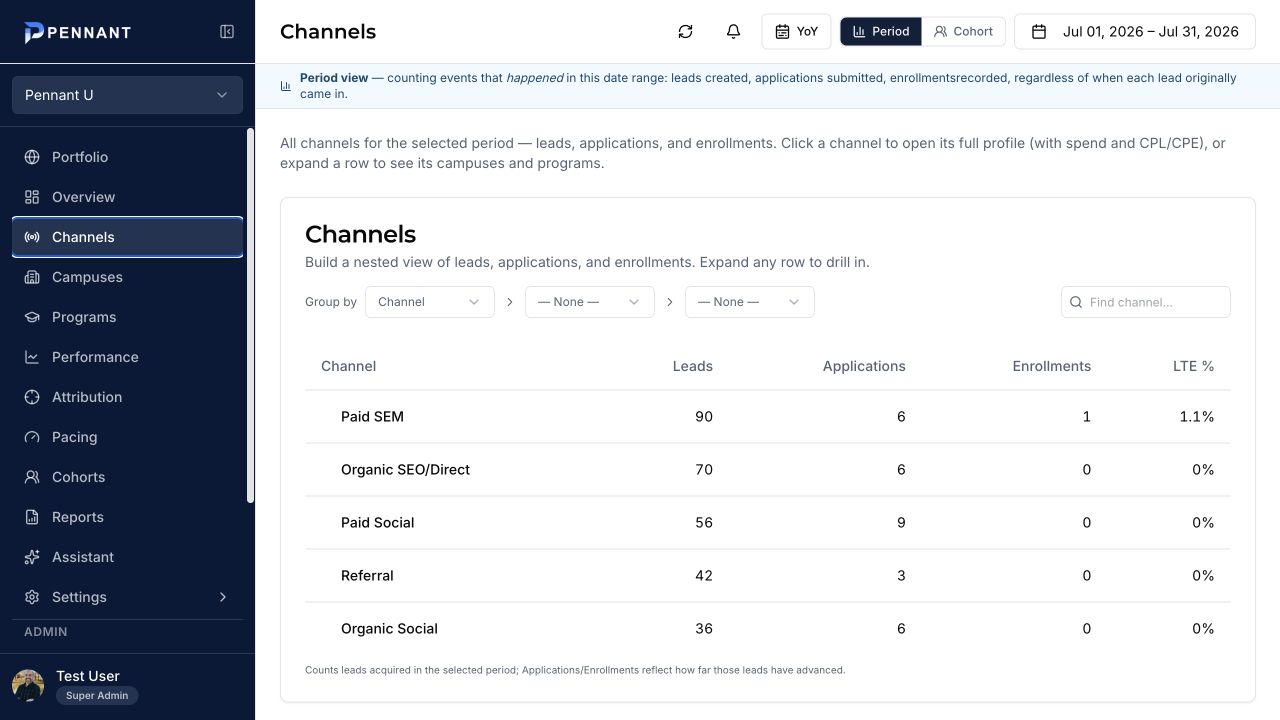
Compare paid and organic channels, open a channel profile, or expand the view by campus and program.
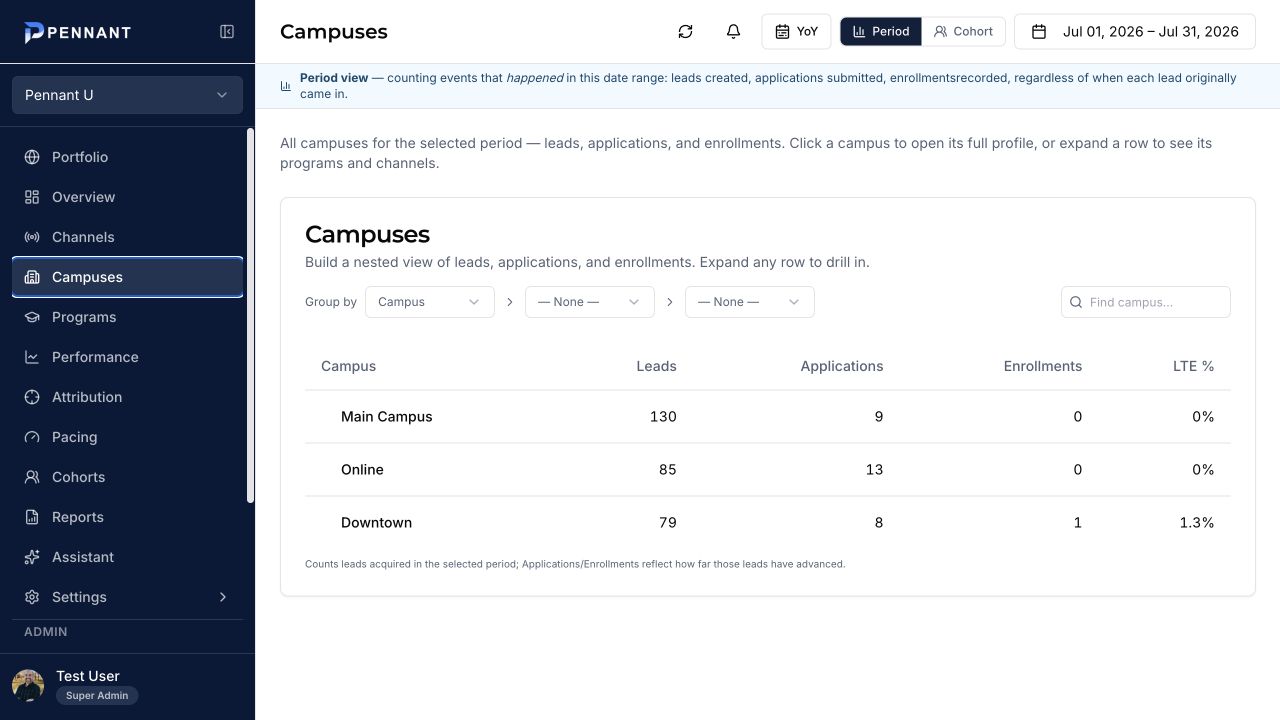
See leads, applications, enrollments, and LTE by campus, then drill into its programs and channel mix.
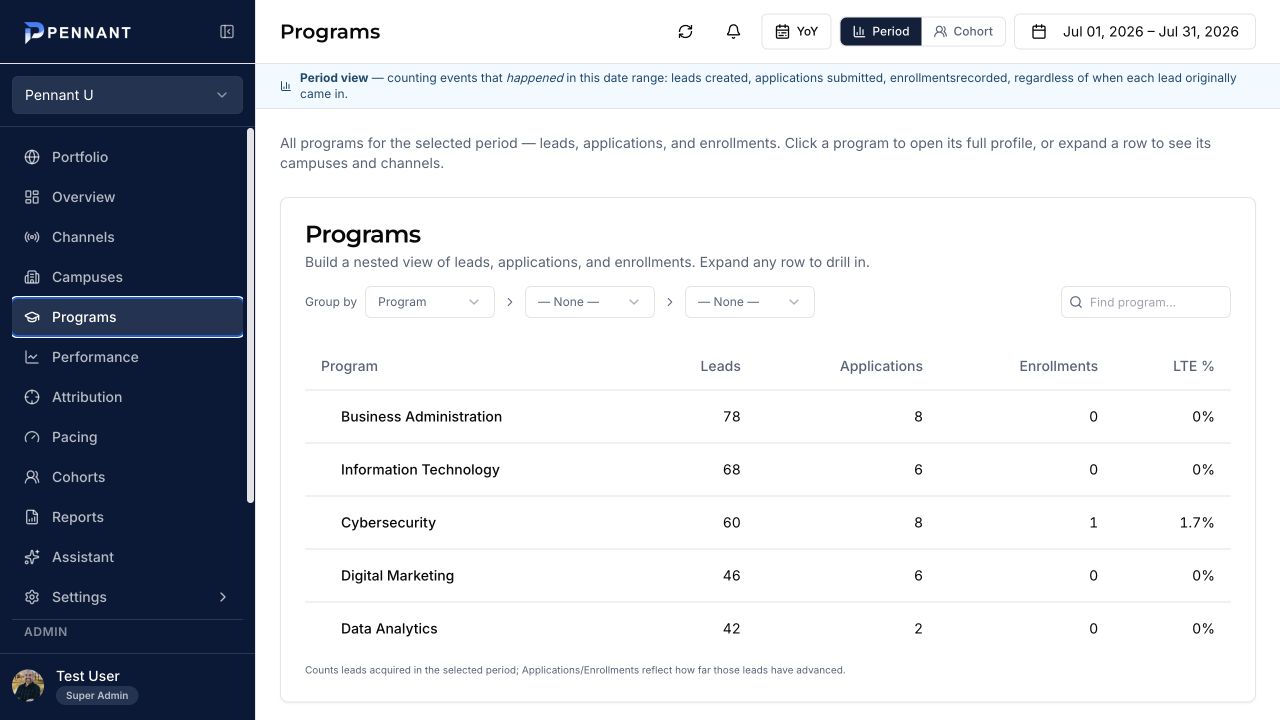
Compare program demand and progression, then explore the campuses and channels behind each result.
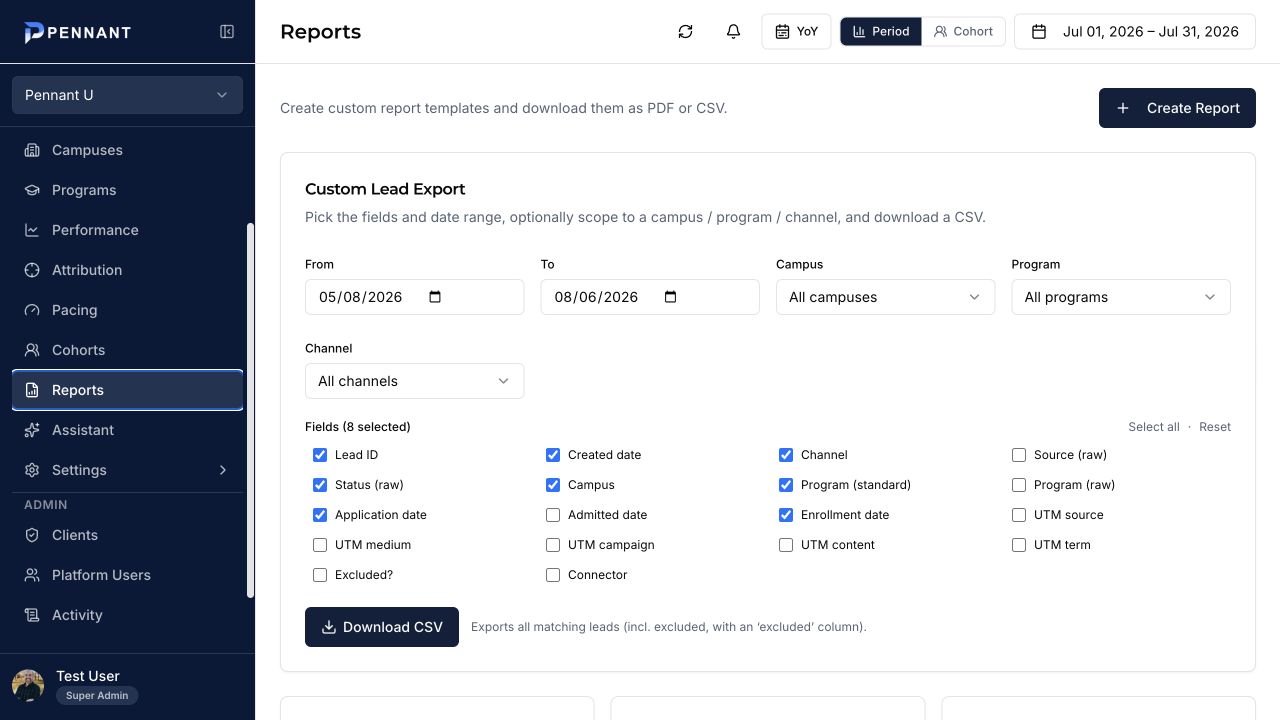
Create filtered lead exports or download executive, weekly performance, and cohort reports as PDF or CSV.
Performance
Create nested breakdowns across campuses, programs, and channels. Expand the path that matters while preserving the same lead, application, enrollment, and LTE definitions.
Pennant Assistant
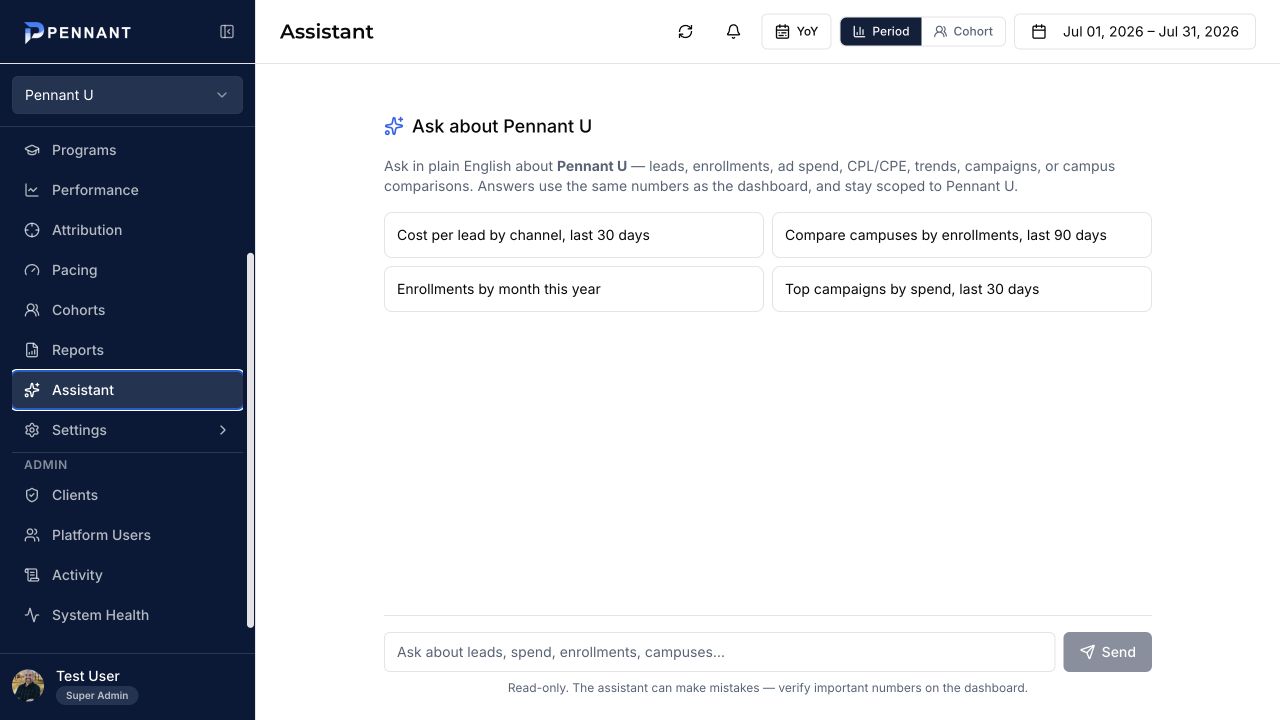
Explore leads, enrollments, ad spend, CPL, CPE, trends, campaigns, and campus comparisons without constructing a new report. Answers stay scoped to the selected institution and use the same numbers as the dashboard.
The assistant is read-only and important numbers should always be verified in the dashboard.
Implementation
Implementation is collaborative. Pennant configures the system and reporting logic; your team confirms access, definitions, source totals, and the decisions the finished view must support.
Discover
Map
Validate
Operate
Pennant brings
Your team brings
Evidence you can inspect now
Pennant does not publish invented customer outcomes. The Pennant U demo tenant uses actual product screens to show how a team moves from an attention signal into attribution, pacing, campus, program, cohort, and reporting detail.
See your enrollment picture clearly
Explore how Pennant can connect your current systems and turn the full enrollment funnel into a view your team can use.
Book a demo